Economy

us.jpg   fr.jpg

Inflation-adjusted returns of stocks and bonds since 1960

August 4.png

Gold price adjusted for inflation since 1920

August 3.png

Average annual tax drag for 5 years ending December 2020

August 2.png

The high cost of investor behavior 1984-2020 (Source: Russell Investor Group)

August 1.png

Tight credit spreads show the need for selectivity (Source: Capital Group)

July 31.png

CPI percent fluctuations since 2000

July 30.png

Timeline of previous vaccine development (years)

July 28.png

Total real return indices since 1802

July 24.png

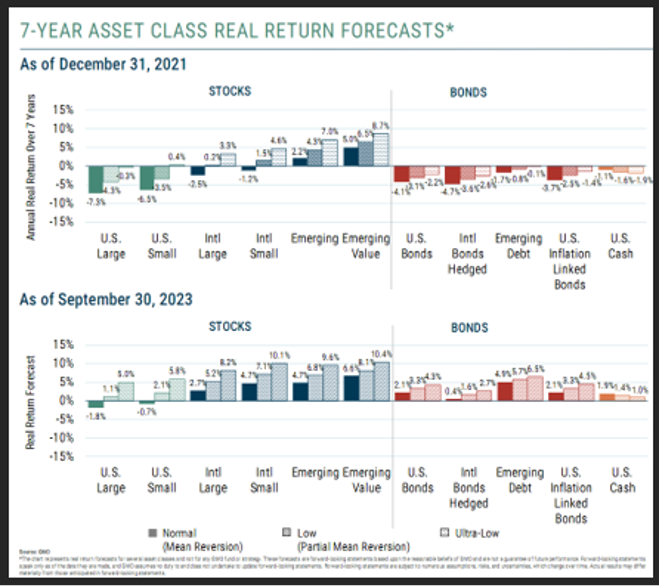
Asset-class return outlooks (Source: Vanguard Investment Strategy Group)

July 21.png

Syndicate content