Economy

us.jpg   fr.jpg

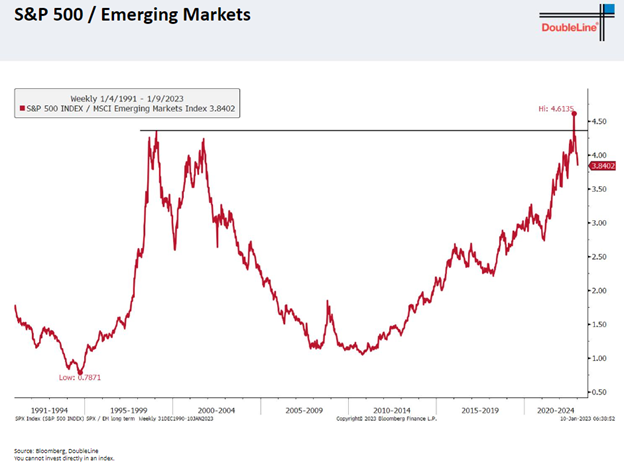
Cycles of US and international equity outperformance since 1971

11.08.21.png

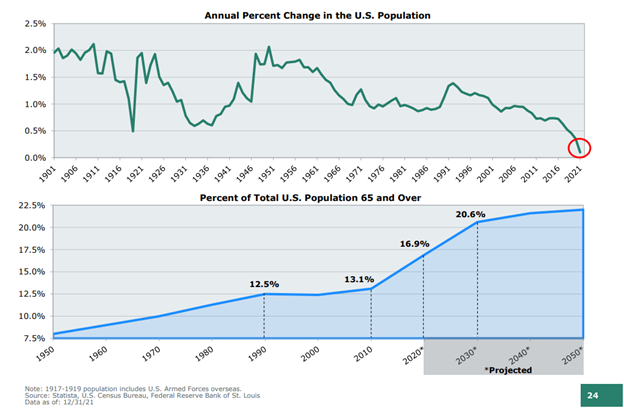
Percent of total US population 65 and over since 1950

11.07.21.png

Wholesale prices in the US (rolling 10-yr. average, annually, %) since 1750

11.02.21.png

Percent of Russell 3000 growth stocks with negative earnings since 1980

11.01.21.png

Household net worth in the US by income group since 2005

10.31.21.png

Adding alternatives can increase diversification when stocks and bonds are positively correlated

10.25.21.png

International: Price-to-earnings discount and dividend yields vs. US since 2001

October 23.png.png

Nominal and real 10-year Treasury yields since 1958

image001.png

Top Half Domestic Funds of 2016 Were Unlikely to Repeat their Accomplishments over 2017-20 (S &P Dow Jones Indices)

September 26.png

Ten Largest Market-Capitalization Stocks in the World at the Beginning of Each Year (Source: Research Affiliates)

September 24.png

Syndicate content