Economy

us.jpg   fr.jpg

S&P 500/MSCI emerging markets and US dollar

Picture122.png

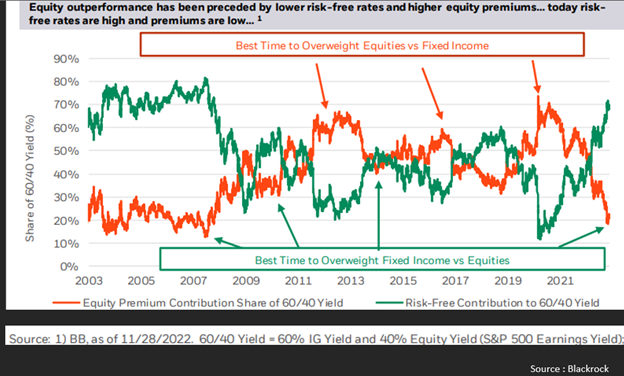
Bloomberg US aggregate bond index's yield to worst versus S&P 500's dividend yield since December 2002

Picture119.png

Historically, the longer the time horizon the more likely you are of making money

Picture118.png

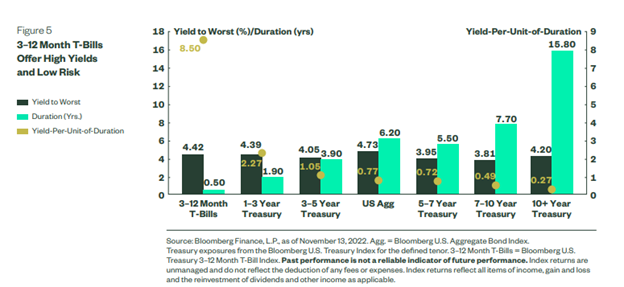
Bloomberg US and global aggregate bond indices: Yield to worst since December 2002

Picture116.png

US versus rest of the world trends since 1994

Picture106.png

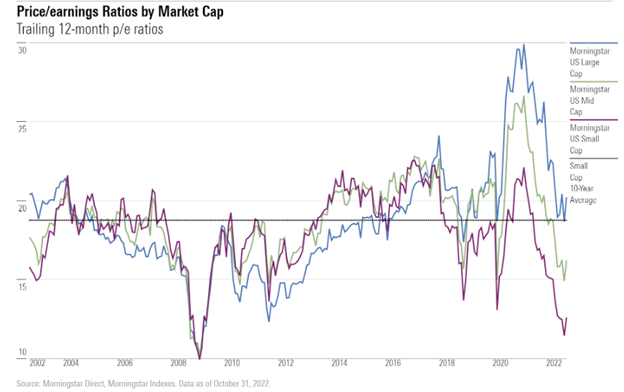
S&P 500 Multiples since 1999

Picture104.png

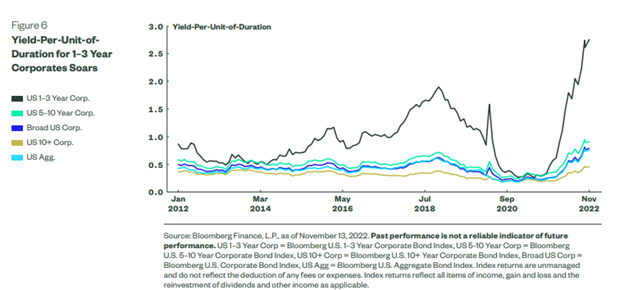
Yield of Bloomberg US aggregate bond index since 2004

Picture102.png

US credit spreads minus government compared to long-term median since 1972

Picture95.png

Years in which US stocks & bonds fell simultaneously since 1928

Picture93.png

When do Europeans retire?

Picture87.png

Syndicate content