Economy

us.jpg   fr.jpg

US home price growth by city, housing affordability index since 1981, and credit score at mortgage origination since 1999

Picture164.png

S&P 500 index: Forward P/E ratio since 1997

Picture162.png

UK housing most unaffordable since Victorian times

Picture155.png

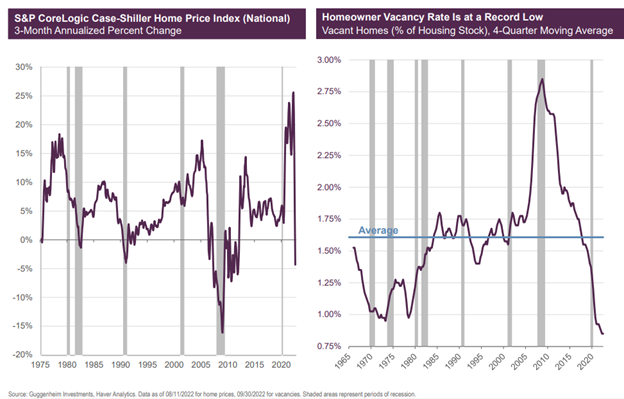
US home prices are falling for the first time since 2012

Picture154.png

Global value spreads since 1990

Picture153.png

S&P 500 index & MSCI EAFE index (in US$) since 1969

Picture152.png

Price-to-book ratio, June 1926-November 2022

Picture150.png

Nominal yield curves unhedged

Picture149.png

Recent value performance in context July 1926-November 2022

Picture148.png

MSCI EM vs. US dollar index (DXY) January 2002-December 2007

Picture147.png

Syndicate content