Valuation

us.jpg   fr.jpg

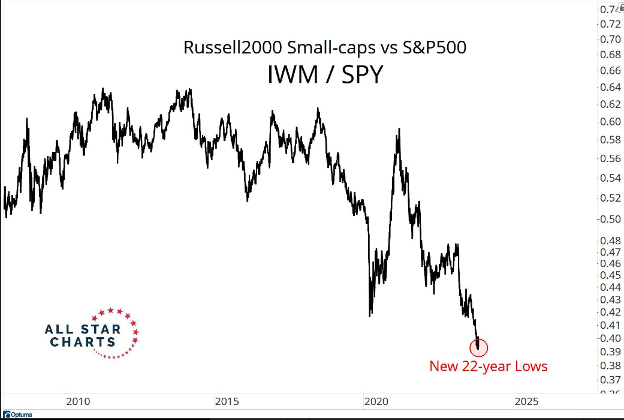
Rusell2000 Small-caps vs S&P500

Picture63.png

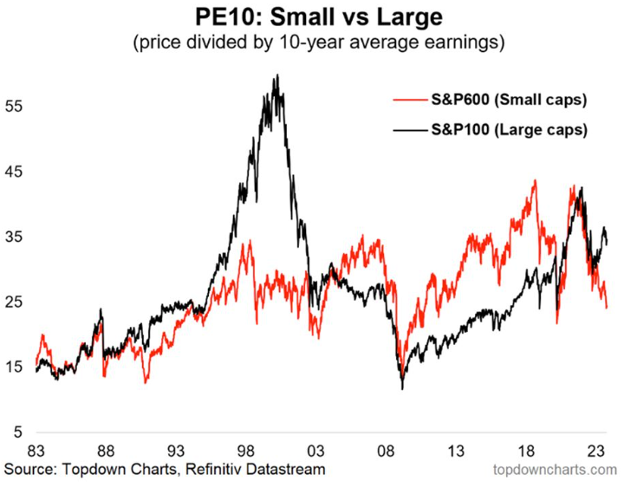
PE10: Small vs Large

Picture59.png

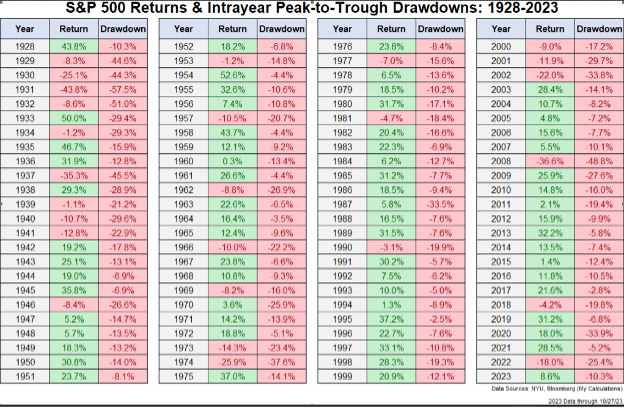
S&P 500 Return & Intrayear Peak-to-Troigh Drawdowns: 1928-2023

Pictur66.png

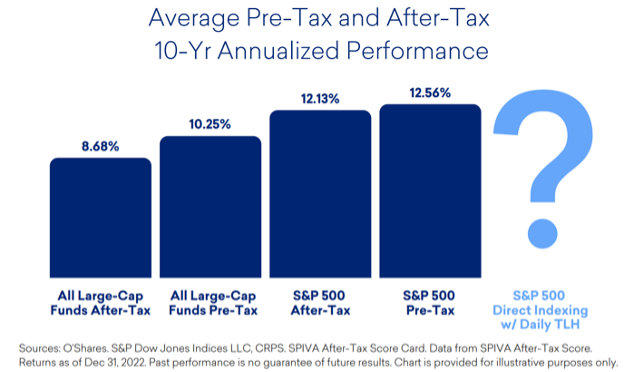
Average Pre-Tax and After-Tax 10-Yr Annualized Performance

Picture50.png

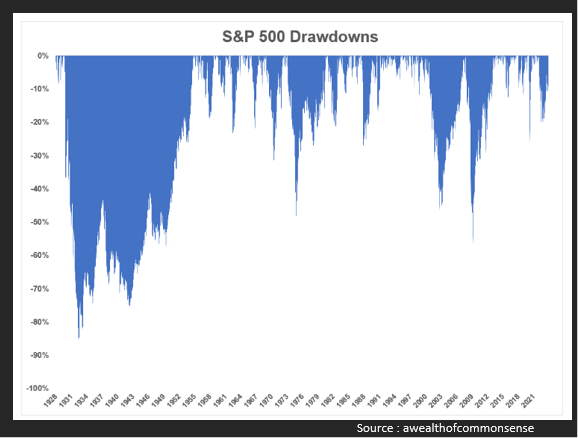
S&P 500 Drawdowns since 1928

Picture47.png

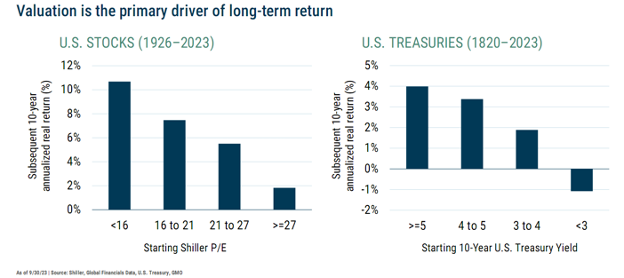
Valuation is the primary driver of long-term return

Picture41.png

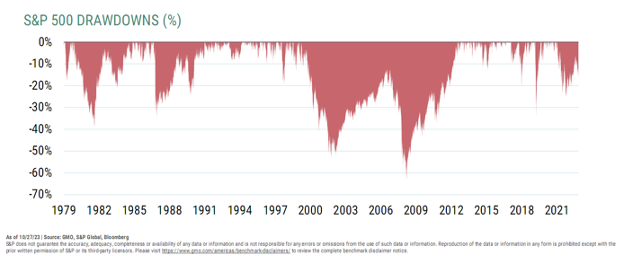
S&P 500 Drawdowns (%) since 1979

Picture40.png

U.S. Growth Price/Sales Since 1971

Picture37.png

Value's discount widened to TMT-like proportions since 1971

Picture36.png

Syndicate content