Blog

us.jpg   fr.jpg

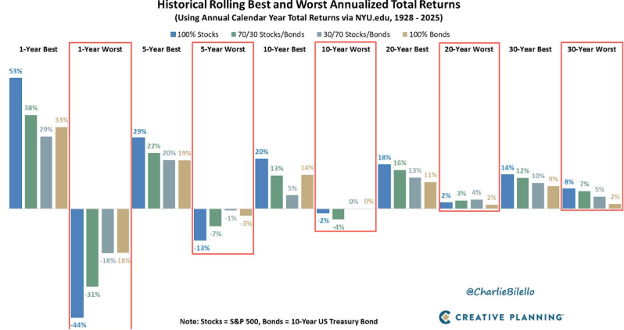
Historical Rolling Best and Worst Annualized Total Returns (Creative Planning 1928-2025)

Blog(5).png

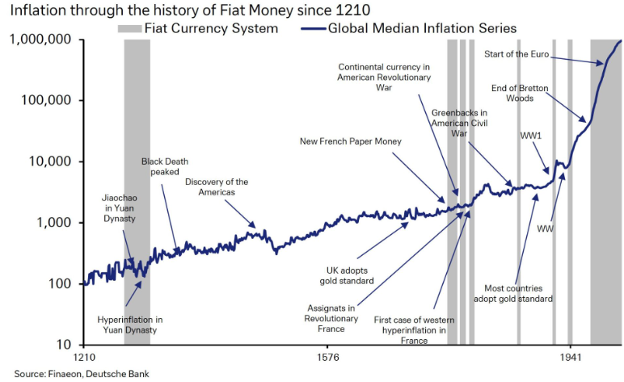
Inflation Through the History of Fiat Money (Finaeon Since 1210)

Blog(4).png

The Key To Happiness (Jon Luskin)

Blog (3).png

Average S&P 500 Performance After Oil Shocks (Bloomberg 1973, 1979, 1990, 2022)

Blog(2).png

Volatility In Stocks Is Normal (Ritholtz 1928-Present)

Blog (1).png

Relative Performance of Selected Assets Over Discrete Five-Year Periods From 1995-2025

image_103.png

Rolling 36-Month Relative Performance

image_102.png

Rolling ten-year performance for US size factor (%)

image_101.png

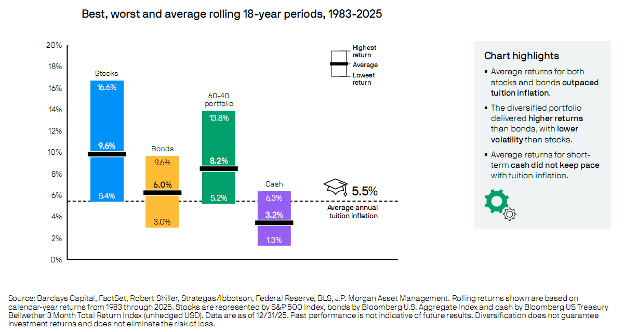
Range of stock, bond and blended total returns

image_100.png

If you're age 65 today, the probability of living to a specific age or beyond

image_099.png

Syndicate content